

- Home
- >
- Data in Action
Data in Action
Data can be a powerful tool to improve the health and well-being of children, families, and communities. You can use it to advocate for polices and legislation, assess community needs, or strengthen grant proposals. It all starts with crafting a message to inspire action, determining what data you need to support your efforts and selecting the best visualization to tell your story. Use the tools in this section to get started.
Featured Examples:
Advocate for Policies and Legislation

|
California Assemblymember Debbie Look on the Committee for Education says, “In analyzing bills that come before the California Legislature, I am often looking for data relating to the education, health, and well-being of children in California.” She uses her data analyses to illustrate the scope of a particular issue facing children and youth in California in order to advocate on their behalf. Related data. "Kidsdata.org is a source that I use on a regular basis for factual, non-partisan data." |
|
The Children’s Partnership is a children’s organization that strives to be both a resource and an ally for underserved communities across California through promoting research-driven policies. It uses data from kidsdata.org to give children and their families a voice through programs and advocacy efforts centered on improving children’s access to quality health care. According to Mayra Alvarez, President of The Children’s Partnership, kidsdata.org “humanizes the numbers,” making it easier to digest the information and to utilize it in infographics, grant applications, and research briefs. Related data. |

|
“CASA of Tulare County uses kidsdata.org for presentations, trainings, and social media marketing. Kidsdata.org is well organized and easy to use. There are a variety of ways to obtain the data you need relative to your area, to your state, and nationwide. Thanks kidsdata.org for not only the wealth of information, but the ease of accessibility to that information as well.” Related Data. – Anthony Guerra, PR & Marketing Coordinator, CASA of Tulare County |
|
Since 2012, the California Homeless Youth Project (HYP) has been partnering with Kidsdata to visualize and promote California Department of Education data on homeless youth in California. In 2014, HYP used the easily-downloadable visualizations on kidsdata.org to enhance their legislative issue brief, webinars, blog post, and data packets that were distributed to legislators across the state. This combined with kidsdata.org’s communication efforts resulted in increased media interest, invited presentations, congressional hearings, and increased interest among state legislators in child homelessness, leading to at least four substantive bills on homeless children and youth. Related Data. |
|
First 5 California Santa Cruz implemented a county-wide initiative last year, Thrive by Three. The initiative’s intent is to support a system of care for early childhood in the county, including home visitation services, childcare and parent support. Their initial evaluation report included relevant data on early childhood demographics, cost of infant care, and preterm birth rates from kidsdata.org. The report’s function is to establish a baseline on county-wide indicators to be monitored and improved in the county. Related data. |

|
Children Now, a nonprofit that supports and connects thousands of child-related groups in California to provide a united front against child health inequalities, included data from kidsdata.org in the 2018 California Children's Report Card. With insightful summaries and thoughtful analysis, the Report Card illustrates the extraordinary challenges California's children face in reaching their full potential, from access to mental health services to school-based health supports. The report card also provides policy recommendations to help improve their health and well-being. Related data. |
Assess Community Needs
|
|
"I am a guest speaker at California State University, Channel Islands, for their public health nursing program on child abuse recognition. I use data from Kidsdata to present child abuse statistics to Bachelor of Science in Nursing students to give them a better understanding of the incidence of child abuse in their specific area. It helps me illustrate local conditions compared to other regions while informing them that child abuse is a problem in their local area—not just a phenomenon that happens elsewhere.” Related data. – Diane Emerick, Program Coordinator, Ventura County Public Health |

|
"Kidsdata.org is an invaluable resource for the March of Dimes Imperial County Healthy Babies are Worth the Wait Project and our efforts to help moms have full-term pregnancies and healthy babies. The site offers access to the most current county level demographic and health data in an easy to use and understandable format. Kidsdata.org allows our project to compile critical data that is often not readily available for our county into community profiles that support grant proposals and effectively focus maternal child priorities to guide our collaborative efforts within the community. Kidsdata.org helps support the March of Dimes work to end premature birth and other problems that threaten our babies." Related Data. – Cheryl Anderson, Project Director, Healthy Babies are Worth the Wait Project, March of Dimes |
 |
In her role as a Chief Operating Officer with PACEs Connection Network, Gail Kennedy, MPH, discovered that kidsdata.org was the source for data used in communities, including schools, county health departments, and local non-governmental organizations (NGOs). In addition, she has seen kidsdata.org used in presentations to school boards, county health commissions, county board of supervisors, and First 5 commissions. When gathering data at the community level, kidsdata.org is her one-stop, easy-to-use repository of data. Related Data. |

|
“I find kidsdata.org a uniquely valuable source for the most important kind of information about children's health. I use it extensively for teaching Child Psychiatry fellows at Stanford, and I share it with colleagues in other parts of the country... Despite their diligence, they always ask how on earth Kidsdata obtains such fantastically practical information about children in their county that does not seem to be available through more local sources.” Related Data. – Carl Feinstein, MD, Professor Emeritus of Psychiatry and Behavioral Sciences at the Stanford University Medical Center |
|
|
The California School-Based Health Alliance uses kidsdata.org to help plan programs with school-based health centers (SBHC), which help children stay healthy and learn better. This organization uses Kidsdata to highlight areas of need in California, such as health and educational outcomes, where school-based health care can make a difference. Related Data. “Kidsdata helps us see ways we can improve health and academic success for California's kids.” – Lisa Eisenberg, MPP/MSW, Senior Policy Analyst |
Strengthen Grant Proposals
|
The United Way of the Bay Area uses kidsdata.org to bolster grant proposals and the agency's community library. India Swearingen, the agency's evaluation and insight director frequently uses the narrative context that accompanies every indicator. “I like the text that explains why the data is important – too often, we put out metrics and don't explain their importance,” she says. While she also uses other data sites, they're not as user-friendly as kidsdata.org and often don't provide data at the county level. Related Data. |
|

|
Spotlight On Hope Film Camp (SOH) is a free filmmaking program for pediatric cancer patients and their families where they create, edit and produce short films. Founder and Executive Director Cassie Nguyen used pediatric cancer patient data in Riverside, Orange County and other regions in Los Angeles from kidsdata.org to estimate the patient population SOH would serve if it were incorporated in those regions. She used the data to support a grant application to fund up to $10,000 toward their goal of establishing SOH at hospitals and other organizations. Related data. |
Crafting a Message for Data-Driven Change
What is your purpose?
A strategic step toward communicating about children's health and well-being is being explicit about your purpose. In addition to clarifying your purpose, understand your social, economic, and political environment as you develop a strategy to use data for change. Consider:
What is a clear statement of your issue? Concisely state the issue.
Why does your issue matter? Answer the "so what" question for why the issue requires action. Elaborate on the problem central to your issue. Think about equity and how the issue affects your community. Use data to support your claims. Consider adding a descriptive narrative or anecdotes.
What is your proposed solution? Describe and substantiate the approach that will most effectively address the issue.
Who are the stakeholders? Stakeholders are your allies and opponents on the issue. Some examples include: policy makers, community activists, local program leaders, service providers, business owners, law enforcement staff, and health department staff. Consider why they are stakeholders, and what do they have to gain from supporting or opposing your issue.
What are the Barriers and Facilitators? What are challenges to enacting change on your issue? What is the current political climate, and what are current priorities? Is your issue a major concern when compared to other current events, and what do you need to do to elevate concern?
Who is your audience?
The data you need depend on your goal and whom you have to convince. In general, the level of complexity you use when presenting data depends on the people you are addressing.
Big Picture: Politicians, the general public and the media are audiences who tend to need information that is descriptive and quickly understandable, often from an overall perspective or big picture point of view. An example is communicating about the extent of emotional health issues among youth by showing the percentage of youth who feel depressed by demographic groups.
Details: Committee staff, special interest groups, and legislative analysts tend to want more detail than the big picture offers. This information will have more layers to it; often the audience understands the general idea but does not understand the details. An example is communicating about access to mental health care services by identifying the percentage of youth who receive mental health care among those who need treatment.
Specifics: Government agencies and academic institutions often need data to be more focused or detailed. Funding or planning decisions may be based on these numbers. An example is communicating about the impact of mental health instability on hospitals by examining categories of hospitalization discharge rates by type and age group.
How will the data support your message?
Some common values that data can address are access, equity, rights, quality, and cost:
- Access—who has access to services, programs, insurance, etc.? Who doesn't?
- Equity—is there an equitable distribution of resources across groups or regions?
- Rights—what are the rights of community members? What laws, regulations, or constitutional protections confer rights? On whom are the rights conferred?
- Quality—how is quality of life, environment, services, and programs impacted?
- Cost—what is the cost to taxpayers, community, business, individuals, and others?
If data are not available for your message, what can you do?
"Proxy" measures are data that can substitute for the data you need because they are closely related to your issue. For example, you may want to improve college readiness among youth in your county. You could use the percentage of students taking college preparatory classes as a proxy of college readiness and make a statement such as, "College readiness among students in our county may be lower than for California students overall, as suggested by a lower rate of college prep course completion in our school districts."
A major advantage of using proxy measures is its low cost. The data can be relatively easy and inexpensive to find or collect. However, there may be concerns with generalizability. You will need to judge whether the data are a suitable proxy and be transparent about your approach.
Can you combine quantitative and qualitative data?
Quantitative data are usually measured and expressed in the form of numbers, rates or percentages. These data answer questions of who, what, when and where.
Qualitative data are usually measured and expressed in the form of words, concepts, themes, or categories. Qualitative data are often used to gain a more in-depth understanding of a particular incident or phenomenon - answering how or why something is occurring. You might use a descriptive narrative or an anecdote.
Combining quantitative and qualitative data strengthens messages. When possible, collect both kinds of data and use them in your work because they serve two different functions when attempting to paint a complete picture of your issue. For example, you may collect quantitative data on percentage of youth who receive mental health care among those who need it and collect qualitative information through interviews, focus groups or surveys with open-ended questions about why some youth don't receive the care they need.
Download a PDF of this page to take with you.
Five Criteria for Good Data
Data have the power to transform the way we see the world, from identifying health disparities to strengthening a case for policy change. When determining the best data to support your work, consider the five criteria below: correlation versus causation, credibility, reliability, generalizability and timeliness. Remember, no data are perfect. Use your best judgment and be transparent.
Kidsdata compiles data from reputable sources. Learn more about where our data come from.
1. Correlation Versus Causation
Correlation refers to two findings that are associated. Causation refers to one finding causing another.
- Without statistical testing, do not assume how data are related. For example, number of substantiated abuse and neglect cases and days with ozone levels above standards have both decreased since 1998. They have the same pattern but are not likely related and one does not likely cause the other. As with any two sets of indicators, you cannot make conclusions about a pattern without testing.
2. Credibility
Credibility refers to the source of the data or who provides the data. Can you trust the entity that produced the data?
- Who paid for, sponsored, or funded the study? Could the data be biased?
- Does the data provider have a stake in a specific finding? Research sponsored by business, religious or political organizations may have missions that influence how they conduct research and interpret findings.
- What is the data provider's reputation for research? Government and academic institutions are considered credible because research is conducted for the public benefit.
3. Reliability
Reliability refers to the accuracy of the data. Can you trust the data?
- Has the research that produced the data been reproduced by other researchers?
- How were the data collected? Did the researchers adhere to ethical research methods?
- If the data come from a survey, is there response bias? For example, did researchers conduct their survey in different languages if they need information about immigrants?
4. Generalizability
Generalizability refers to data on a specific population that can be used for other populations.
- Generalizability depends on the way in which the data provider collected the data.
- Understand "who, what, why, when and where" of the data and consider whether the data can apply more broadly. For example, if the data describe Hispanic children, could they also describe Latin American children?
- Be cautious about claiming generalizability and be clear about how populations differ.
5. Timeliness
Timeliness refers to when the research was conducted relative to changes in the environment.
- When was the study done - one year ago, three years ago, or over 10 years ago? And, how fast are changes occurring - months or years? Some data may be relevant over a longer period of time than others.
- Often there will be a lag time, especially with big studies such as the American Community Survey (ACS). Most comprehensive surveys will be a few years old by the time findings are published.
- Even if the research seems old, it may be the best source if more recent data are not available. Admit the limitations of the data and supplement it with other closely related research.
Download a PDF of this page to take with you.
Telling Your Best Data Story
You have five options for visualizing and sharing data on kidsdata.org. Choose among tables, bars, trends, maps, or pies to express your message through data. Use it to monitor trends, identify disparities and make comparisons. You can use these figures in reports, presentations, proposals, advocacy work, program planning, and other efforts on behalf of children and youth in California. Note that some indicators do not have all figure types due to data limitations.
Table
- Good choice for providing complicated numeric, percentage, or rate information.
- Useful for comparing data for various geographies, groups, or time periods.
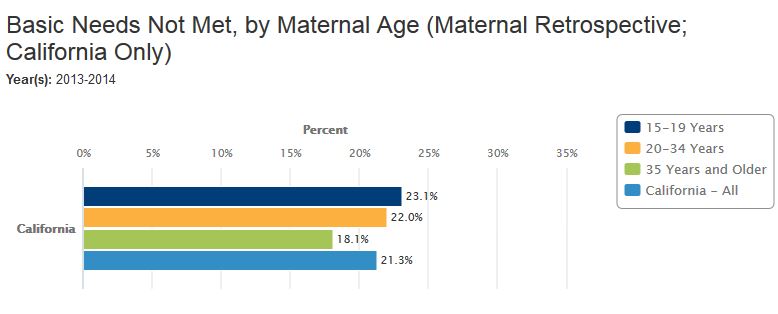
Bar
- Good choice for comparing quantities and percentages for a single category or timeframe.
- Bars are easy to read and work well to compare differences across groups.
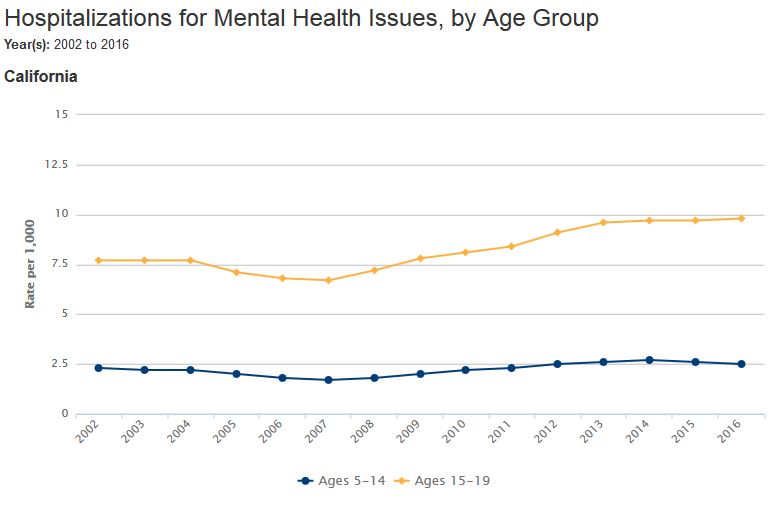
Trend
- Good choice to illustrate trends over time. Line movement is easy to interpret.
- Keep the figure simple by including fewer than four lines; avoid frequently overlapping lines.
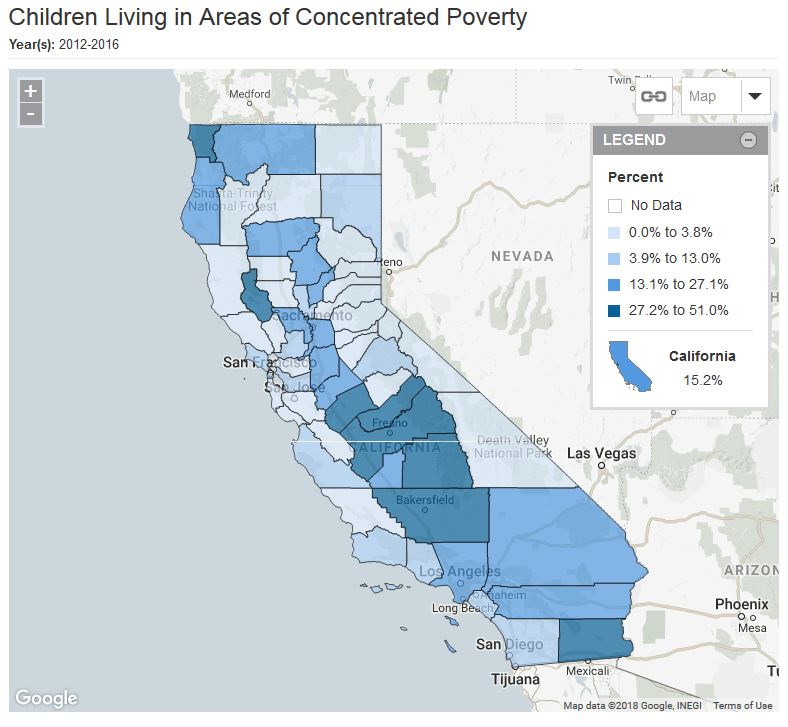
Map
- Good choice to illustrate differences across areas and to provide a broad visual of the issue.
- Demonstrates areas of need and disparity through color.
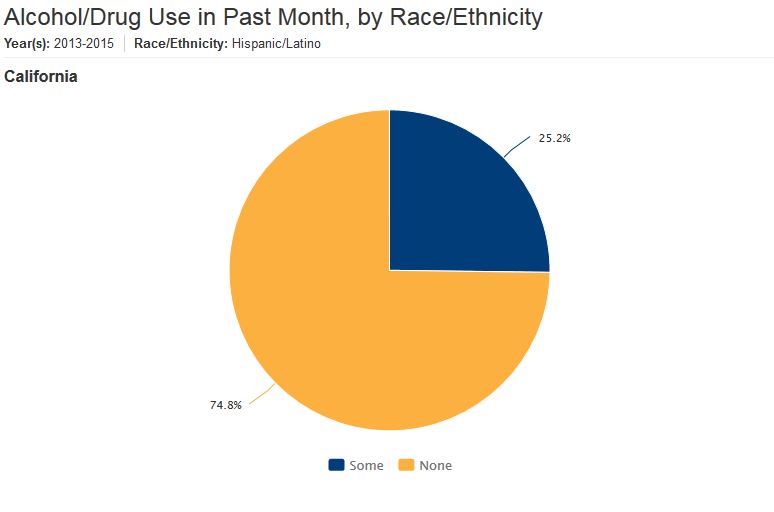
Pie
- Good choice to show each part as a proportion of a whole.
- Use for data that have few categories (typically two to five).
Download a PDF of this page to take with you.
More Data Tools
The following free resources offer tips, guidance, and strategies for effectively using data as a tool for change.
- Community Tool Box
- County Health Rankings & Roadmaps Take Action Center
- Data Resource Center for Child and Adolescent Health
- Forum Guide to Taking Action with Education Data
- Resource Center for Community Health Assessments and Health Improvement Plans
- Understanding Evidence
- U.S. Census Bureau Guidance for Using the American Community Survey
Here are some additional free websites that may be useful in your work.
- American Fact Finder
- California Child Welfare Indicators Project
- California Communities Environmental Health Screening Tool
- California Department of Education DataQuest
- California Health & Human Services Open Data Portal
- California Health Interview Survey
- California School Climate, Health, and Learning Survey (CAL-SCHLS) System
- CDC Wonder
- ChildStats.gov
- Child Trends DataBank
- Community Commons
- County Health Calculator
- County Health Rankings & Roadmaps
- Data Resource Center for Child and Adolescent Health
- Data.gov
- Diversitydatakids.org
- Ed-Data
- Food Environment Atlas
- Health Indicators Warehouse
- Healthy City
- Kaiser Family Foundation State Health Facts
- Kids Count Data Center
- Migration Policy Institute Data Hub
- National Center for Education Statistics
- Population Reference Bureau Data Finder
Tips on Using Kidsdata.org
Check out these tips for getting the most from kidsdata.org:
- Select the 'Download & Other Tools' option that accompanies every data visualization, such as on this page.
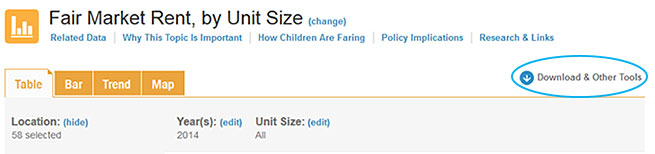
There you'll find the following options for incorporating the selected data into your work:
- Copy your customized table, graph, or map into Word or PowerPoint for your report or presentation.
- Download the data as a CSV or Excel file to analyze and make your own charts and graphs.
- Embed your customized visualization onto your website. The embedded visualization will update automatically when new data are added to the indicator.
- Generate a PDF that includes your data along with an overview of the selected topic.
- Share, Tweet, or Email your data using the 'Share' options near the indicator name.

- Scroll past the data visualization for topic-specific contextual information including narrative summaries, policy implications, related kidsdata.org indicators, and links to resources and reports with additional information.
- Build a custom data profile for your region: Select the 'Create Custom Profile' option next to your selected location's name in the Data by Region section—from there you can choose specific measures of interest to you and create a custom data report.
- Get printable PDF fact sheets here for specific topics, regions, and demographic groups.
- Visit our Help page for more tips on using kidsdata.org.
Want to receive a training on how to use kidsdata.org? Let us know by emailing kidsdata@prb.org, and be sure to include your location.
Receive Kidsdata News
New and notable data findings delivered regularly to your inbox.