Infant Health in California: Mostly Positive Trends, Except for Low Birthweight
Half a million babies are born in California each year. Ensuring their early good health and well-being lays the foundation for positive outcomes throughout childhood and into adulthood. Both nationally and statewide, infant health indicators are trending more positively, with low birthweight outcomes the notable exception. Overall, the state’s most populous counties have made major strides.
Key kidsdata.org findings:
- Infant mortality in California is on the decline, down 36% from 1994 to 2012, to 4.5 deaths per 1,000 live births. This is a record low for the state.
- In all but five California counties (of those with sufficient data to track), the infant mortality rate declined between 1996-98 and 2010-12.
- Of the eight counties with the highest infant mortality rates in 2010-2012, five are in the Central Valley.
- The state’s teen birth rate also has been declining, down 59% between 1995 and 2012, to 25.7 per 1,000 young women ages 15-19.
- Of the state’s most populous counties, Riverside (the state’s fourth largest) saw the most dramatic decrease, a 66% drop in the teen birth rate from 1995 to 2012.
- Contra Costa County saw a 65% decrease and San Mateo County a 64% decrease in that time period; of all counties, Placer and Tuolumne led the state, each with a 79% drop in teen births from 1995-2012.
- In 2012, 84% of infants in California had mothers who received prenatal care in the first trimester of pregnancy, up from 79% in 1995.
- In 36 of the state’s 56 counties with available data, the percent of infants whose mothers received prenatal care increased from 1995 to 2012.
- California is also making gains in the percentage of newborns who are exclusively breastfed during hospitalization after birth; 63% of babies in 2012 (up from 57% in 2010).
- Between 2010 and 2012, all but ten counties with available data saw increases in the percentages of newborns that start out receiving only breast milk.
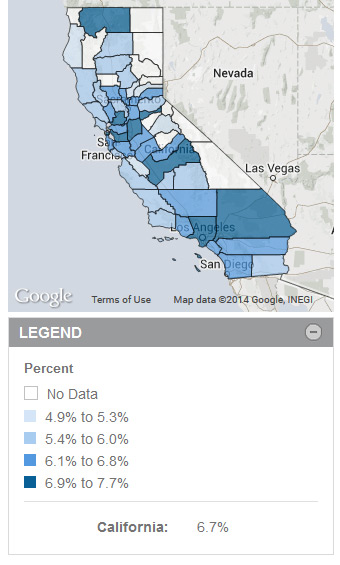
- In an exception to the positive trends, of all infant births in the state, babies born at a low birthweight increased steadily, though only slightly, each year from 6.1% in 1995 to 6.7% in 2012.
Read More About These Topics
Helpful Links
Kidsdata Tip
Did you know you can embed kidsdata charts, tables and maps directly into your website or blog? Click "Download & Other Tools" link at the top right hand corner of any data page, such as this one, then click Embed/Preview to customize your graphic. Then just paste the embed code provided into your website. Your new graphics will automatically be revised on your site whenever we update our data. Handy!
.
|
Infants Born at Low Birthweight (2012)
|