The
California Index of Child and Youth Well-Being
..................................................................................................................................................................................................................
Results by Race/Ethnicity
When applied to racial/ethnic groups for which enough data are available (African Americans, Asians, Latinos, and Caucasians), the California Index of Child and Youth Well-Being shows similar gains for these four groups, as the table below notes. However, rates of improvement were more variable at the regional level - in Los Angeles County and the Bay Area.
|
View Charts by Race/Ethnicity: |
||||||||||||
Racial/Ethnic Disparities Among California's Children
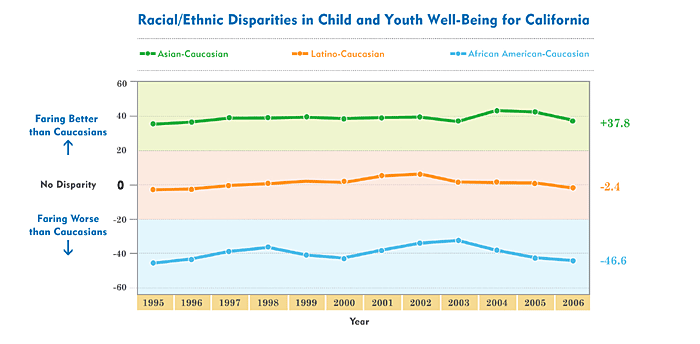
| This graph shows disparities over time for each racial/ethnic group compared to Caucasians. Asian children consistently are faring better than Caucasian children, while African American kids consistently are faring worse. |
|
In addition to measuring rates of improvement in overall child well-being, separate indices were created to measure disparities in levels of well-being among California's racial/ethnic groups.
Using these "disparity indices," there are some noticeable gaps between racial/ethnic groups - and these hold true across all three regions. Moreover, these disparities persisted over time, as the graph to the right shows.
In this graph, Caucasian children are used as the contrast group (although any racial/ethnic group could be used for comparative purposes) to illustrate how African Americans, Asians, and Latino children each compare to Caucasian children.
If California's African American and Caucasian children were faring equally well over time, this graph would show a straight line at 0, signifying that neither race/ethnicity had an advantage over the other. The negative scores (represented by the blue line) mean that there was a persistent disparity between the two race/ethnicities (-49 points in 1995 for California and just slightly better, -47 points, in 2006) with Caucasians consistently faring better.
However, the gap between Latino and Caucasian children (represented by the pink/orange line) in California was not nearly so large (-2 points for Latinos in 2006, compared to -47 points for African American children).
By contrast, Asian children (represented by the green line) consistently fared better than Caucasian children - by about 38 points in California over the 11 years studied.
For details about how these race/ethnicity disparities were calculated, see the full report's methodology section.


