Just Updated: Kids' Weight Data for Your Community
 |
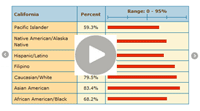
Children’s Weight: Improving or Declining? View this slideshow to see the data.
|
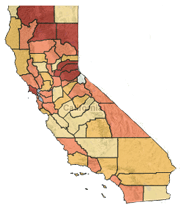
This week, kidsdata.org brings attention to children’s weight in California, a follow-up to last month’s focus on kids’ fitness results. In California, the percentage of 5th and 7th graders at a healthy weight (69% for both in 2010) has held fairly steady over the past decade, while the percentage of 9th graders at a healthy weight improved slightly, from 65% in 2002 to 71% in 2010.
Highlights from the New Weight Data
Slideshow:
Blog Posts:
Reminder - Webinar Tomorrow:
Regional/Local Breakdowns
Following are local breakdowns for the state’s most populous regions. See data for other regions (you can customize your regions by using the “choose counties and school districts” box).
Los Angeles:
About two out of every three Los Angeles County 5th, 7th, and 9th graders are at a healthy weight, according to ’10 data, which is similar to previous years. Percentages of students at a healthy weight vary greatly by school district, ranging from less than 60% to more than 90%.
County and School District Data
Other Southern California Counties:
The percentages of students at a healthy weight vary greatly across Southern California. For example, the percentages of 5th, 7th, and 9th graders at a healthy weight generally fall below the state averages in the most inland Southern California counties (i.e., San Bernardino, Imperial, etc.), but reach or exceed the state averages in most coastal counties (i.e., San Diego, Orange, Ventura, etc.).
School District Data, by County:
Imperial | Orange | Riverside | San Bernardino | San Diego | Santa Barbara | Ventura
Central Valley:
5th, 7th, and 9th graders in the Central Valley generally have among the lowest percentages statewide of students at a healthy weight. In most Central Valley counties, these figures fall below the statewide average.
School District Data, by County:
Fresno | Kern | Kings | Madera | Mariposa | Merced | San Benito | San Joaquin | Stanislaus | Tulare
Bay Area:
Most Bay Area counties fare well compared to the state on this measure of children’s weight. In many Bay Area counties, 70% or more of 5th, 7th, and 9th graders are at a healthy weight, according to the ’10 data.
School District Data, by County:
Alameda | Contra Costa | Marin | Napa | San Francisco | San Mateo | Santa Clara | Santa Cruz | Solano | Sonoma
Sacramento:
The percentages of Sacramento County 5th, 7th, and 9th graders at a healthy weight (about 70%, depending on the grade) were slightly higher than the state as a whole in ’10.
County and School District Data
Perspective on These Data
Snapshot of Related Legislation
Tools to Help Make Your Case for Kids in California
As a foundation devoted to raising the visibility of issues
facing children in California, we want to connect you to the
data and information you need:
 Sign
up for e-alerts to receive automatic e-mails when
data you care about are updated.
 Get
answers to your questions about children's data by posting
on our Facebook page or on our
blog page devoted to Q&A.
 Stay up-to-date on news and topics affecting California kids
through a
fact of the day on Twitter.


