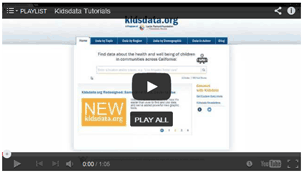
Make the Most of Kidsdata.org: Video Tutorials Show You How
Kidsdata.org is easy to use, but you can get even more out of its advanced features by clicking on our video tutorials.
Kidsdata.org Overview: Learn the basics of kidsdata.org, such as what it has to offer and how to navigate the site.
Finding Data by Topic: Discover the best ways to search for data in topics ranging from physical health to emotional well-being.
Finding Data by Region and Demographic Group: Explore the data by county, school district, city, legislative district, age range, racial and ethnic categories, and more.
Customizing Data: Learn how to create data visualizations, including trend charts, bar graphs and maps, and how to tailor them to meet your needs.
Downloading and Sharing Data: See various ways to download large data sets, share data visualizations through social media, and embed charts and graphs on your website or in your blog post.
Having Trouble Finding What You’re Looking For? Learn how to use search features and navigation menus to find the data you need.
E-alerts and Kidsdata Newsletter: Check out how to sign up for data alerts tailored to your interests, along with our newsletter.
Need more personalized assistance? You can always contact us at kidsdata@lpfch.org.
New Webinar! How To Put Legislative District Data To Work For California Children
Tuesday, July 15, 2014 10:00 AM - 11:00 AM PDT
REGISTER>>
If you work for, or regularly connect with, state or federal lawmakers on behalf of California children, this 1-hour webinar is for you. You'll learn how to use kidsdata.org to:
- Access data available by legislative district
- Overlay legislative maps on many indicators of child health and well-being
-
Find the data you need, by topic, region or demographic group
-
Customize visualizations to meet your needs
-
Download data for analysis
-
Communicate your data and findings in reports, presentations, proposals, social media and more
|
Watch the tutorial videos: 
|

