CA Soda Taxes: Where Could Their Impact Be Greatest?
Taxing soda is associated with decreased soda consumption, according to the first analysis of the impact of Berkeley, California’s 2014 soda tax. Published earlier this summer in the American Journal of Public Health, the study shows that after the tax was implemented, sugary beverage consumption fell by 21 percent in Berkeley, while water consumption rose by 63 percent.
Berkeley was the first city in the nation to levy a tax on soda. This fall, three more California cities—San Francisco, Oakland, and Albany—will consider such a tax on their November ballots. An effort to pass a statewide soda tax in California failed to gain steam earlier this year.
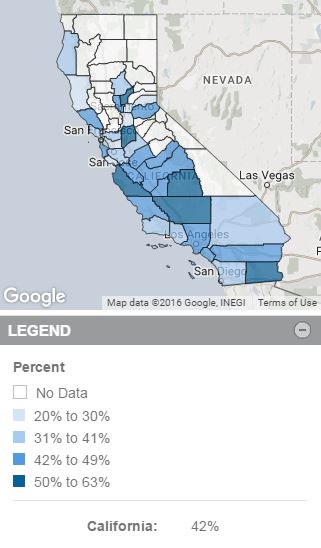
The latest data on children drinking sugary beverages in California are now available on Kidsdata. San Francisco and Alameda counties, home to the four cities that have passed or are considering passing soda taxes, had the lowest percentages (about one in five) of children drinking sugary beverages, among counties with data. In Yuba, Kern and Tulare counties, all in the central valley, three in five children drank at least one sugary beverage per day.
Statewide, in 2013-2014, two out of five children drank one or more sugary beverages per day. Among the youngest children, those between 2 and 11 years old, the gap between ethnic groups is large. More than half of young black children drank sugary beverages per day, compared with one-third of young Latino and Asian children and one-fifth of young white children.
Children should minimize consumption of sugary beverages, which are linked to poor health outcomes, including unhealthy weight gain and obesity. Experts suggest promoting cross-sector, comprehensive strategies to reduce consumption of sugary beverages and increasing the availability of healthy, affordable food and beverage options for children and families, particularly in low-income communities.
Related Data (by State, County & School District)
Helpful Links
BreakfastFirst, California Food Policy Advocates
CDC Healthy Schools, Centers for Disease Control and Prevention
Let’s Move! America's Move to Raise a Healthier Generation of Kids
Breakfast and the Achievement Gap Among Urban Minority Youth, Journal of School Health
Majority of Young Children in California Eat Fast Food Regularly but Drink Less Soda, UCLA Center for Health Policy Research
Still Bubbling Over: California Adolescents Drinking More Soda and Other Sugar-Sweetened Beverages, UCLA Center for Health Policy Research & California Center for Public Health Advocacy
Snacks, Sweetened Beverages, Added Sugars, and Schools. American Academy of Pediatrics
Kidsdata Tip
Did you know that Kidsdata breaks down data by a number of demographic groups? The categories include age, gender, immigrant/non-immigrant, income level, race/ethnicity, and children with special health care needs.
|
Children Drinking One or More Sugar-Sweetened Beverages Per Day
Year: 2013-2014

|

