California Public School Enrollment Continues Decline
Although California’s public school enrollment rose nearly 20% in the past two decades, it has been on a slight but consistent decline since 2005, in a reflection of California’s shrinking child population.
Approximately 6.2 million K-12 students were enrolled in public school in 2012, down about 2% since 2005, according to new data available from kidsdata.org.
Some counties have seen sharper declines, including Los Angeles County, where public school enrollment dipped 9% between 2005 and 2012. Some rural counties with small student populations shrank by as much as 32% during that period.
In general, as school enrollment decreases, so does average daily attendance (ADA). Declines in ADA result in decreased per pupil funding from the state.
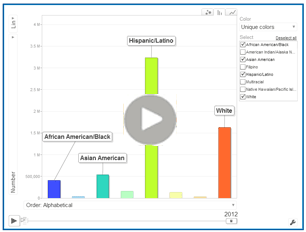
The data also show a striking shift in the racial/ethnic composition of public school students. The percentage of Latino students enrolled in California public schools continues to rise, with Latino students comprising 52% of all public school students in 2012.
In contrast, the proportion of white students continues to shrink: they made up 31% of public school children in 2005, compared to 26% in 2012. African American student enrollment also declined by nearly 20% between 2005 and 2012.
Following are more data about public school enrollment in California, as well as links to related education data on kidsdata.org.
School Enrollment in California: Data Highlights
- According to 2012 data, more than half (55%) of California's public school students are in five Southern California counties (Los Angeles, Orange, San Diego, Riverside, and San Bernardino).
- Los Angeles County alone makes up 25% of public school enrollment for California, yet public school enrollment declined by 9% between 2005 and 2012, as noted.
- However, from 1994 to 2012, public school enrollment in California increased by 18%. Enrollment growth was particularly notable in two counties – Placer (75%) and Riverside (69%).
The Updated Data: Enrollment Numbers | Racial/Ethnic Breakdowns
Statewide Changes in Racial/Ethnic Breakdowns
About three out of every four California students in public schools are children of color. As noted, about half (52%) of public school students in 2012 were Latino, up from 37% in 1994. By comparison, the proportion of students who were white dropped from 42% in 1994 to 26% in 2012. African American student enrollment declined almost 20% between 2005 and 2012 statewide.
See these and other racial/ethnic trends through an animated chart of California public school enrollment.
Find More Education Related Data
|

This interactive motion chart highlights trends in public school enrollment by racial/ethnic group across California.
|

