The New School Year – Find Local Enrollment and Other Education Data
As districts statewide begin a new school year, kidsdata.org has just updated public school enrollment figures to include data from the 2010-11 school year. This past school year, California's public schools enrolled 6.2 million students, which is about one million more students than in 1994, but about 100,000 fewer than in 2005. In a majority of counties and school districts in California, enrollments have declined since 2005.
Following are more data about public school enrollment in California, as well as links to related education data on kidsdata.org.
School Enrollment in California: Data Highlights
- According to 2011 data, more than half (55%) of California's public school students are in five Southern Californian counties (Los Angeles, Orange, San Diego, Riverside, and San Bernardino).
- This past school year, Los Angeles County alone made up over 25% of public school enrollment for California; on its own, the Los Angeles Unified School District represented about 10% of California's public school population.
- From 1994 to 2011, public school enrollment in California increased by 18%. Enrollment growth was particularly notable in two counties – Placer (74%) and Riverside (69%).
- Of 1013 school districts with both 2005 and 2009 data, 579 districts (57%) enrolled fewer students last school year than they did in 2005 (see spreadsheet to find the percentage change for your school district). 60% of counties experienced declines. In particular, rural counties have experienced the most significant enrollment declines. In general, as school enrollment decreases, so does average daily attendance (ADA). Declines in ADA result in decreased per pupil funding from the state.
- The Updated Data: Enrollment Numbers | Racial/Ethnic Breakdowns
Statewide Changes in Racial/Ethnic Breakdowns
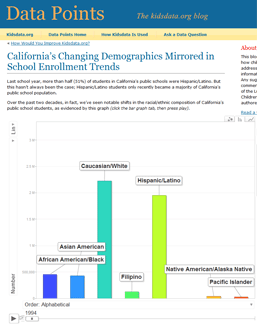
About three out of every four California students in public schools are students of color. More than half (51%) of students last school year were Hispanic/Latino, up from 37% in 1994. By comparison, the proportion of students who were Caucasian/White dropped from 42% in 1994 to 27% in 2011.
See these and other racial/ethnic trends through an animated chart of California public school enrollment on our Data Points blog.
Map Your Community's School Enrollment Data
Click on the maps below and use the "Show Regions" menu to find local school district data.
African American/Black Students
In California, Solano County (17%) and Alameda and Sacramento counties (both at 14%) had the largest percentage of African American/Black public school students last school year. See map >>
Asian American Students
Among California counties, San Francisco (39%) and Santa Clara (27%) had the largest percentage of Asian American public school students last school year. See map >>
Caucasian/White Students
The California counties where 60% or more of students are Caucasian/White all are in Northern California, according to data from last school year. See map >>
Filipino Students
Among California counties, Solano (9%), San Mateo (8%), and San Francisco (5%) had the largest percentage of Filipino public school students this past school year. See map >>
Hispanic/Latino Students
Among California counties, Imperial (89%) and Monterey (74%) had the largest percentage of Hispanic/Latino public school students last school year. See map >>
Multiracial Students
Multiracial students make up 1.8% of public school students in California, according to 2011 data. See map >>
Native American/Alaskan Native Students
Across California, there were 43,546 Native American/Alaskan Native public school students last school year. See map >>
Pacific Islander Students
Among California counties, San Mateo had the largest percentage of Pacific Islander public school students in 2011 (2.5%). See map>>
Find More Local Education-Related Data
|

This interactive motion chart shows various racial/ethnic trends in public school enrollment.
|

