New Tool Lets You Map Data by Legislative District
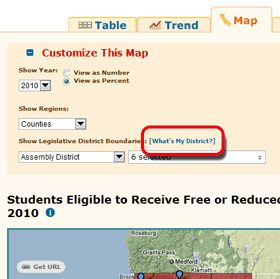
At kidsdata.org, we often are asked whether we can provide child health data by legislative district. While data sets collected by district are limited (see related blog post), we have just launched a mapping tool that makes it easy to overlay legislative district boundaries over other data sets. This tool allows you to select the data you want and then add legislative borders, so that you can visualize what’s happening in one or more Congressional, State Senate, and Assembly districts statewide.
How To:
It takes less than a minute to create your legislative data map. See a step-by-step tutorial on how to use this legislative map overlay tool >>
Use This New Map Function to:
- Build maps showing critical child health and well being data for your district
- Identify data "hot spots" and areas of need
- View data from previous years to see changes in your district over time
- Print maps to take with you to advocacy or policy meetings
Some Examples:
|

Don’t know your legislative district? Find out by clicking on "What's My District?" in the Customize This Map section.
|

