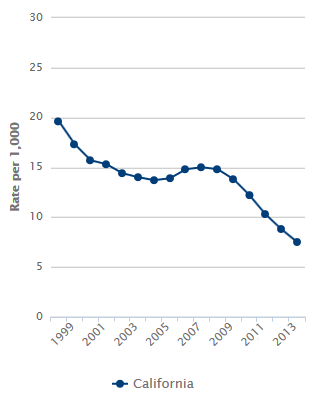
Felony Arrest Rates for California Youth Have Declined 62% Since 1998
The felony arrest rate for California youth continues its remarkable decline, although racial disparities in arrest rates persist.
California's juvenile felony arrest rate declined by 62% between 1998 and 2013, from 19.6 per 1,000 youth ages 10-17 to 7.5. Researchers have reported (PDF) that socioeconomic changes, changes in reclassification of marijuana offenses and a range of other factors may have played a role in that decline.
At the county level, juvenile felony arrest rates vary widely, ranging from 4.8 to 23.5 arrests per 1,000 youth in 2013.
See juvenile justice data by county, gender, race/ethnicity and type of offense>>
In 2013, 38% of juvenile felony arrests in California were for property offenses, 27% for violent offenses, 21% for other offenses (e.g., weapons, hit-and-run), 11% for drug and alcohol offenses, and 3% for sex offenses. Statewide, boys account for the vast majority of juvenile felony arrests.
Among racial/ethnic groups, African American youth are arrested at higher rates than their peers in other groups. In 2013, African American and Latino youth together comprised 75% of all juvenile felony arrests in California. Youth of color have been disproportionately represented in the juvenile justice system for many years, statewide and nationally.
Read more about juvenile felony arrest rates in California, including policy implications>>
See Felony Arrest Rate Data for California Youth
Helpful Links
Bureau of Justice Statistics, U.S. Department of Justice
CrimeSolutions.gov, Office of Justice Programs
Criminal Justice Statistics, Office of the Attorney General of California
Fight Crime: Invest In Kids, California
National Center for Youth Law: Juvenile Justice
Office of Juvenile Justice and Delinquency Prevention
PolicyforResults.org, Center for the Study of Social Policy
Urban Networks to Increase Thriving Youth (UNITY), Prevention Institute
Youth Crime and Justice Publications, Chapin Hall at the University of Chicago
If you missed our recent webinar on work on behalf of children and families who are homeless or are at risk of becoming homeless, the recording is now available. Nearly 270,000 public school students in the state were homeless at some point in the 2012-2013 school year. New data from the California Homeless Youth Project and available only on kidsdata.org, are sorted by county, school district and legislative district. The data include information by grade level and nighttime residence. In this webinar, you'll learn more about this important new data set and how to use it in your work.
|
Juvenile Felony Arrest Rate
Years: 1998 to 2013

|

