Just Updated: California Data on Child Hospitalizations for Injuries
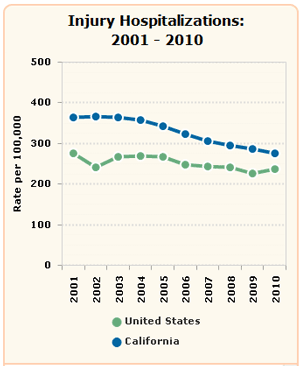
In 2010, California had more than 30,000 hospitalizations for non-fatal injuries among children and youth ages 0-20. Although the California rates consistently are higher than national figures, the statewide rate of child/youth hospitalizations for injuries decreased by 33% between 1993 and 2010. Most of these hospitalizations are due to unintentional injuries, such as car accidents and falls. See rates in your county>>
Find Data for Your Community
Useful Links
Map Data by Legislative District with Kidsdata Tool
Kidsdata.org has a mapping tool that makes it easy to overlay legislative district boundaries on other data sets. This tool allows you to select the data of interest to you and then add legislative district borders over your data, so that you can visualize what's happening in one or more of California's Congressional, State Senate, or Assembly districts. It takes less than a minute to create your data map with legislative district boundaries. See a step-by-step guide on how to use this legislative map overlay tool >>
Please note: This tool will be updated with the new legislative boundaries post-election season. |

California's rate of child/youth hospitalizations for injuries decreased by 33% between 1993 and 2010. However, California's rates consistently are higher than national figures.
|

