Despite inroads, California's air pollution map hardly changed
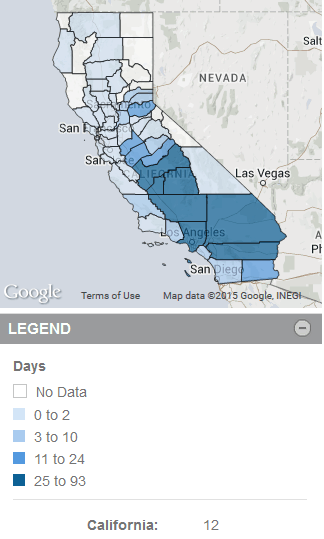
Ground-level ozone, which is formed from car and power plant emissions and is a primary component of smog, poses considerable health risks for all, but especially for children. At the start of the new century, in 2001, the six California counties with the most high-ozone days were all located in the Central Valley and in Southern California. More than a decade later, while the total number of such days is down by 64% across California, the same six counties continue to suffer from the worst air quality (by that measure) in the Golden State, according to the most recent data available on kidsdata.org (see map at right).
In 2013, Fresno, Kern, Los Angeles, Riverside, and Tulare counties experienced more than 40 days with ozone levels above the U.S. regulatory standard. San Bernardino County, however, had 93 high ozone days, nearly eight times the statewide average of 12 days per year.
From the Los Angeles and Long Beach ports, trucks clog the already congested freeways and trains load tons of goods as they haul 40% of the country's incoming cargo containers each year. The weather doesn't help, either. From the coast, sea breezes blow emissions eastward, where they are blocked by the San Bernardino Mountains, adding to the high concentration of ozone in the hot and dry Inland Empire area.
Southern California and the Central Valley also suffer from the highest rates of particulate matter concentration in the air, which includes chemicals, metals, dust, and other components.
Exposure to air pollution increases the risk of many health conditions, including respiratory problems, heart disease, cancer, and adverse reproductive or pregnancy outcomes. Children are particularly vulnerable to pollutants because they breathe in more air relative to their size, and because their bodies are not fully developed (see Why This Topic Is Important).
Experts recommend improving indoor air quality in schools and child care settings by addressing issues such as building ventilation and exposure to mold and other hazardous materials. The most effective way of reducing health risks however, is by enforcing and strengthening laws that limit vehicle emissions, agricultural pesticide exposure, and industrial pollutants.
Related Data:
Helpful Links
California Environmental Health Tracking Program, California Department of Public Health
Creating Healthy Indoor Environments in Schools, U.S. Environmental Protection Agency
Health Effects of Air Pollution, California Environmental Protection Agency, Air Resources Board
Agricultural Pesticide Use Near Public Schools in California, 2014, California Environmental Health Tracking Program
Costs of Environmental Health Conditions in California Children, 6/2015, California Environmental Health Tracking Program, Public Health Institute
Outdoor Air Pollution a Leading Environmental Cause of Cancer Deaths, 2013, International Agency for Research on Cancer, World Health Organization
Ozone and Health (PDF), 2014, U.S. Environmental Protection Agency
Kidsdata Tip
Our short tutorial videos cover how to find the data you need, tailor the data format for your needs, export data for analysis, and communicate your data in reports, presentations, proposals, social media, and more. More information>>
|
Air Quality: Days with Ozone Levels Above Regulatory Standard
Year: 2013

|

