|
Visualizing data by legislative district helps identify areas of need and strengthens communication with your legislator. Kidsdata offers easy access to data for specific legislative districts on various topics. For all other topics where data are not broken down by districts, our legislative boundary overlay tool is a great option. Users can customize a map overlay by Assembly District, State Senate District, and U.S. Congressional District for a visual representation of district borders. Follow these three easy steps to take your map data to the next level!
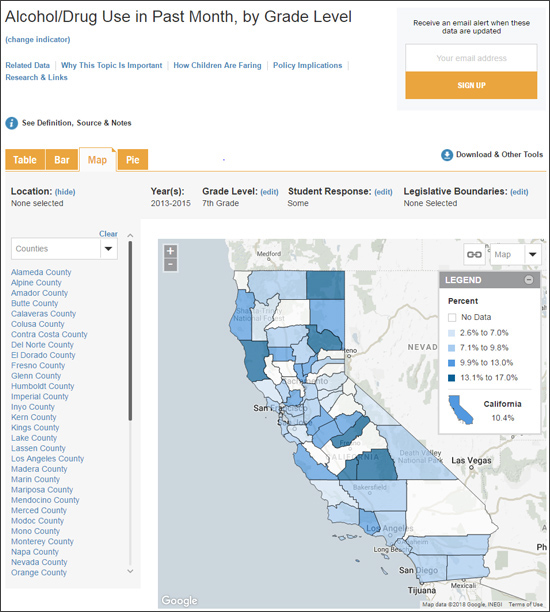
1. Choose your data map of interest:

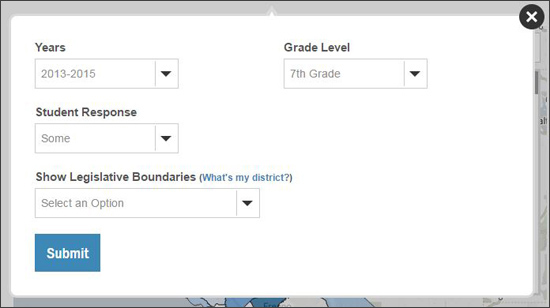
2. Click Legislative Boundaries. Select the type of district. If you’re not sure about your district, click “What’s my district?” for more information.

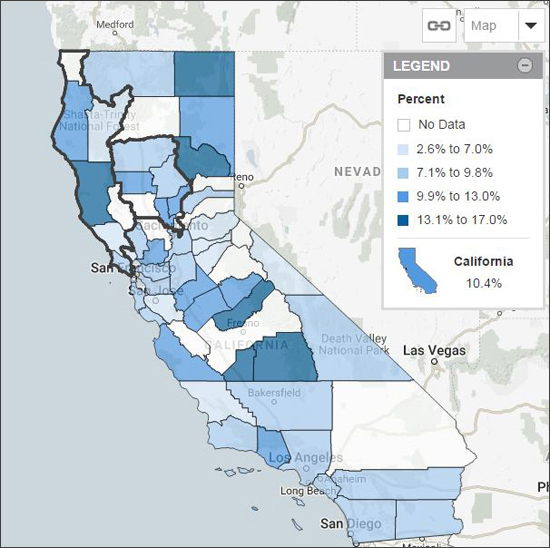
3. Customize the districts you would like to see on the map. You can select as many as you want, or, click “Check All” to view all districts.

Share your map with legislators, stakeholders, and advocates!
7th Grade Alcohol/Drug Use in Past Month, 2013-2015, in California State Assembly Districts Two and Four

Check out more helpful tips »
|


